GridTracker Control Panel
The Control Panel has several sections and packs a wide range of information and functions into a small space.
Operating Information

“GridTracker”
Clicking on the button labeled “GridTracker” at the top of this section will turn the GridTracker Control Panel on and off.
“Frequency / Date & Time”
The first two lines beneath the GridTracker button show your current operating frequency, band and mode followed by the current date and time UTC.
➤ Practice Tip: Click on the line with date/time info to toggle between UTC and your local time.
“Working Callsign / Location”
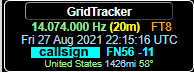
The two lines after the date and time show the callsign and geographic location of the station you’ve most recently either sent a message to or received a message from, their grid square and the dB level of their Tx. It also shows their country, distance between your station and their station, and the azimuth.
If you are offline or aren’t connected to WSJT-X these lines are blank.
Tx/Rx Status
This button shows the status of WSJT-X operation.
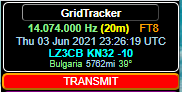
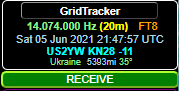
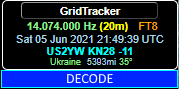
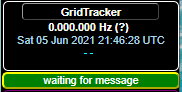
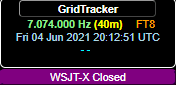
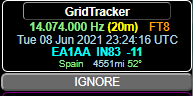
Click on the Tx/Rx status button to ignore incoming messages from other GridTracker Users
NOTE: clicking on this button shuts off incoming data from WSJT-X except for log events.
Band Activity
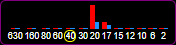
This bar graph shows data retrieved from PSK Reporter based on the grid square you use as your QTH. (Note: the feed from PSK Reporter may be stopped or delayed if their servers are overwhelmed.) This graph shows:
What band you are currently using - it’s circled. In the illustration above it’s 40 meters.
The current, relative activity on bands. In this example it looks like about 75% of users are on 20 meters, and 25% are on 17 meters.
Red: Score (A value calculated by PSK-Reporter to indicate the overall score of this band for your current operating mode in your gridsquare)
Blue: The number of stations Spotted in your current operating mode.
On Mouseover of any of these will show you the Score: XXX Spots:ZZZ TX: AAA RX: BBB
XXX: being the calculated score from PSK Reporter
ZZZ: the number of remote stations spotted in your gridsquare
AAA: The number of active stations transmitting from your gridsquare
BBB: The number of receiving stations from your gridsquare.
If you want to see a display of spots where your Txs have been heard, use the View PSK Spots button in the Features menu.
QSO Status
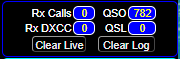
RX Calls: Number of callsigns received in WSJT-X in your current start up of Gridtracker.
QSO: Your total number of contacts to date. By default this is the total number of contacts reflected in your current, working WSJT-X log. If you elect to import QSO data from additional logs then that number will increase accordingly.
➤ Practice Tip: the total number shown here depends on the GridTracker options you’ve chosen and whether you’ve elected to include or not include QSO data from other sources besides WSJT-X.
➤ Practice Tip: if you click on the QSO count (the number in the oval) it opens up the GridTracker Statistics page.
Rx DXCC: Number of DXCC stations received in WSJT-X in your current start up of GT.
QSL: Number of “confirmed” contacts in your logbook.
It’s important to distinguish between what the WSJT-X software calls a “confirmation” and a “confirmation” that happens in a logging site or application such as LoTW.
A contact is “confirmed” in WSJT-X when you either click either the “ADD” or “Log QSO” button in the main WSJT-X window OR you click the “OK” when using the automatic logging feature. But that’s different from a “confirmation” that occurs when you and another station both and independently submit information to - say LoTW - that you had a QSO.
GridTracker won’t “see” logging information from any source other than WSJT-X unless you tell it to. To do this you must specifically select the option(s) to upload information from sources such as LoTW or eQSL and that happens in the Settings > Logging submenu.
Clear Live: Clears the current live data displayed in GridTracker
Clear Log: Clears your working log information - both the QSO count in the QSO Status Box and grid highlighting – but does not delete any files. You might choose to do this if you want to change which log files are loaded and shown in GridTracker. See the Logging Options and Functions section in this manual for a detailed discussion of options for importing existing log data.[1][1]
Note: Generally speaking you don’t have the option to not show WSJT-X QSO data. GridTracker will always retrieve the information contained in the wsjtx_log.adi file stored on your computer when you start up the program.
Load Logs: This command loads: (1) the wsjtx_log.adi file and (2) any other .adi / .adif files that you have told GridTracker to load at startup. See the Logging Options and Functions section in this manual for a detailed discussion of options for importing existing log data.
See the GridTracker Data Files Storage section at the end of this manual for more information about where your GridTracker QSO log data is stored.
Map View Filters
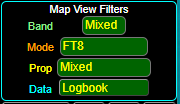
This section allows you to decide what type and how much information to be shown on the GridTracker Map in the master grid overlay. (Other overlays such as time zones and grayline are handled separately in the GridTracker Features menu.)
➤ Important Practice Tip: the options in this box affect how much and what type of data is shown in not only the “day-to-day” working grid map but also in the award overlays and Statistics table! The colored grid map view overlay for your logbook data reflects the band, mode, and propagation options you’ve picked. If you want to see a grid overlay with all of your contacts regardless of band, mode or data then choose “Mixed” on all three of those Map View Filters options.

Band
Gridtracker automatically tracks WSJT-X. That means that it will show the “grid status”, i.e., whether you have worked a grid or if a station within any particular grid is actively transmitting on the band you’ve selected. There are some bands in the drop down list where United States hams can’t operate. But GridTracker is available for users worldwide and other countries have different band privileges.
Auto: shows the grid status of the band currently in use in WSJT-X (or last used if you’re starting a new session.)
Mixed: shows the grid status of all bands
Specific Band: shows the grid status of that specific band.
NOTE: Each of these choices is further refined by the Data stream you select: Logbook, Live, or Logbook & Live, see below.
Mode
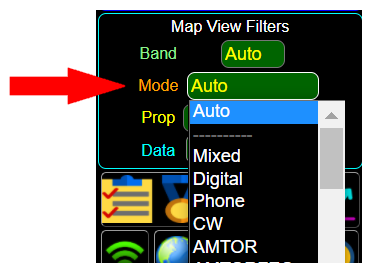
The mode selector lets you refine the grid display as broadly or as narrowly as you please. The drop down list lets you choose a type or mode of transmission such as phone, digital, or CW; a specific digital protocol, (FT-8, PSK, JT9, etc.) or “Auto” or “Mixed”.
Auto: shows the grid status of the mode currently in use in WSJT-X (or last used if you’re starting a new session.)
Mixed: shows the grid status of all the contacts you’ve loaded into Gridtracker regardless of mode. SSB, CW, all digital or individual digital modes all mixed together. There are over 100 modes to choose from!
Digital, CW, FT-4, FT-8, PSK31, WSPR, etc. Shows your QSO grid for the specific mode you select.

Prop[agation]
Select Propagation Mode to display. The **_default _**value is Mixed however you can also choose “unknown” along with 18 others.
Data
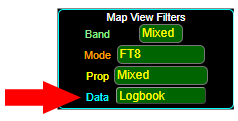
Clicking on this box cycles the main GT map through three options: Logbook, Logbook & Live, or Live. (Alternatively you can just type the Hotkey Q as long as GridTracker is your active window.)
Logbook Data: Grids are highlighted if you have logged a contact [have a QSO] in the grid in the past. The highlighting color scheme is shown in the map legend. The default color assigned to QSOs is yellow but you can change the color scheme in the Settings > Grids submenu.
➤ Practice Tip: The information shown in the Logbook overlay depends on the options selected in the **Settings>Logging **submenu. If you want to incorporate QSO data from anything other than your working log in WSJT-X then you must choose the options to load that data from LoTW, QRZ.com, etc. in the form of an ADIF file.
If you want the grid overlay to show QSL data then you must load data from a local ADIF file, LoTW, QRZ.com, etc. Again: the data stream and log records from WSJT-X don’t know whether or not another station has confirmed a QSO.
Logbook & Live Data: Grids are highlighted if you have logged a contact in the grid in the past OR if a station in the grid is currently active. If both situations apply then the grid is divided by a diagonal line. The top triangle of the grid is highlighted with the legend color for QSOs; the bottom with the legend color for stations calling CQ etc.
Live Data: Grids are highlighted to reflect whether or not a station is currently active.
GridTracker Features Menu
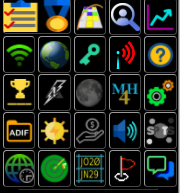
The screen grab above shows you the default version of the GridTracker Features Menu. If you choose certain options in the Settings submenus you’ll see additional buttons for additional features.
Open Call Roster Hotkey R

The Call Roster function is so extensive it has its own section in this manual. But, in short, it’s a mult-function feature that you can use to track and pounce on stations calling CQ.
Push-Pin Mode Hotkey P

This feature turns the grid color legend off and places a “push pin” in the center of every grid where you’ve made a contact instead. If you are in Live mode there will be a gold pin in every active grid (i.e. a grid with an active station.) In Logbook mode there will be a red pin in the grids where you have made a QSO. In Logbook & Live mode you’ll see a mix of gold and red pins
Open Callsign Lookup Window Hotkey R

You can look up who owns a callsign any time – whether you have WSJT-X running or not – by clicking this button, typing the call into the Callsign box and either clicking on the “Lookup” button or typing the “Enter” key on your keyboard.
GridTracker uses Callook.info as the default website for a callsign lookup. However you can manually change to another website in the SETTINGS>Lookups sub-menu.
Since GridTracker is linked with WSJT-X you can select an option to have GridTracker automatically open a window with callsign information every time you transmit on WSJT-X. See Settings>Lookups for those settings. When you click on a CQ in WSJT-X to respond to it, this feature will automatically look up that station.
➤ Practice Tip: The amount and type information shown in the Callsign Lookup window is dependent on the website you choose for your lookups.
Show Stats Hotkey I (the letter i)

This is your GT logbook and statistics window. The data it contains can be filtered and sorted in nearly innumerable ways. While the Awards button lets you see a visual representation of the extent of your contacts; the Statistics feature lets you see them in list form.
➤ Practice Tip: The information shown on the Statistics page(s) depends on the options selected in both the Map View Filter and the Settings>Logbook submenu.
Online/Offline Mode


Toggles the Online/Offline status of GridTracker. When offline, online maps are not available and the default offline map is used. Also GridTracker will not attempt to log QSOs to or sync from online logging services and OAMS and Spotting services are not available. This mode optimizes GridTracker for use when Internet connection is not available or highly unreliable (such as Field Day and POTA activities).
Grayline On/Off Hotkey N


Choose to show or not show the grayline between daylight and night.
GridTracker Map Legend On/Off


See Settings>Grids for details on the map legend.
Share On-Air Status


Do or don’t share your on-air status with other GridTracker users. However you won’t be able to use the View GridTrackers Users function unless you are sharing your status.
HotKey List Hotkey F1

See Appendix C for a full list of the HotKey options.
➤ Practice Tip: GridTracker must be your active computer window for this or any other HotKeys to work.
Cycle Award Overlays Hotkey = (equal sign)


Press this button (or its HotKey equivalent) to cycle through a series of overlays to show your status towards various awards.
Your award achievements can be filtered using the Map View Filters to show all your contacts or narrowed down to contacts by any combination of band or mode.
__ : A line under the award cup is the default view; no awards shown (Hotkey **** 1) Note, you need to press “1” to clear any award overlays. The award overlay keys do not toggle on/off.
CQ : the CQ zones you’ve contacted (Hotkey **** 2)
ITU : ITU zones you’ve contacted (Hotkey **** 3)
WAC : Worked all Continents – the continents you’ve contacted (Hotkey **** 4)
WAS : Worked all States – the U.S. states you’ve contacted (Hotkey **** 5)
DXCC : the DX countries you’ve contacted (Hotkey **** 6)
USC : the U.S. counties you’ve contacted (Hotkey **** 7)
US48 : the Maidenhead grids you’ve contacted in the continental U.S.A. (Hotkey **** 8)
➤ Practice Tip: The Alphanumeric Maidenhead grid codes cannot be superimposed on top of any of the award grids.
Award Overlays + Active GridTracker Map Hotkey U
If you would like to see any of the Award Layers _in addition to (or on top of) _ the highlighted grids displayed on the GridTracker map there are two ways to make that happen.
1. Always Show Awards on top of Grid Status: Go to the Settings>Map menu and click the button for “Merge Award Overlay”. This will “permanently” show an award layer superimposed on your base grid status layer.
2 a. Option to Show Awards on top of Grid Status: Leave the “Merge Award Overlay” button unchecked in the Settings>Map menu.
b. While you have an Award Layer active, type the letter “U” (Hotkey U)
This will add the active Grid Status map data underneath the Award Later. Note: Grid Status may be Live, Logbook, or Logbook & Live. And you can independently cycle through those three states.
Moon Position Tracking Hotkey D


Shows the position of that big ball of cheese on your GT map.
Maidenhead Grid Size Hotkey W


Switch between Maidenhead 4 and Maidenhead 6 grids.[^2]
GridTracker Settings Hotkey S

There are extensive menu options under the Settings Sub-Menu that allow users to optimize GridTracker to suit their specific preferences. Each of these submenus is discussed in it’s own section. This button toggles the settings pane on and off.
Load ADIF Log Hotkey L

Clicking this button opens a directory window for the folder where your local GridTracker_QSO.adif file is stored. All you need to do is click on that file name (or actually any other .adi/adif file you’ve stored there) and it will be uploaded into GridTracker, (i.e., it doesn’t have to be the GridTracker file.)
See the GridTracker Data Files section for info on where your operating system stores the GridTracker_QSO.adif file.
View Current Solar-Terrestrial Conditions Hotkey C

Source: http://www.hamqsl.com/solar.html
Donations

Clicking on this button takes you to GridTracker’s website where you can give a little back to the folks who’ve made GT a free download.
Audio On/Off Hotkey M


You can choose to receive audible alerts from GridTracker when a variety of events occur. This button allows you to turn the audio on or mute.
View PSK Spot Reports Hotkey O


Clicking on this button will give you a map of PSK Reporter data for your transmissions.
When you turn on PSK Spot Reporting a new tool opens at the bottom of the Control Panel that allows you to select the length of time for which data is reported by moving the orange slider button. 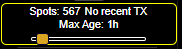
➤ Practice Tip: Given the size of the slider it can be difficult to “fine tune” the time reporting period by clicking and moving the slider. However if you simply click on the button you can then use your left arrow (⇦) and right arrow (⇨) keyboard keys to set the time period to your preference.
There are several options available for PSK data:
Go to Settings > Grids and click the button on/off for “PSK-Spots Over Grids’’ to select whether you want the PSK data overlaid on top of your grid map or shown in place of the grid map. (OR you can use the Hotkey T to toggle whether the PSK-spot data is an overlay on top of your grids or a separate map.)
Go to Settings > Map to select options for
the PSK-spot color
whether or not to show the PSK-spot paths and
PSK-spot path width.
NOTE: You can narrow down the PSK data reported by using the Map View Filters to select a specific band or or mode.
Your PSK 24 Hour Report

Clicking this button will retrieve PSK data from the past 24 hours and plot it on your Grid Map by marking the relevant grids in the same color used to mark current, real time QSX / Station-2-Station contacts. The shading for this added “PSK info” will fade out over time and eventually disappear according to the time limit you set in Settings > Grids for live grid decay.
This button has to be turned on before it will show up in your Control Panel. See the Sections>Logging menu.
Load Local Log

This button has to be turned on before it will show up in your Control Panel. See the Sections>Logging menu.
Clicking on this button loads specified ADIF files that you have stored on your computer. “Specified” means that you have told GridTracker where to find one or more .adif (or .adi) files stored on your computer or a network you can access. You do that by going to the Settings > Logging menu, clicking on the “Add File” button, and entering the path and file name of each individual .adif file.
Download LoTW Log

This button has to be turned on before it will show up in your Control Panel. See the Sections>Logging menu.
Note:
If you download and import your LoTW data from the web, GridTracker creates a separate but temporary LoTW.adif file stored in the cloud where the GridTracker_QSO.adif is stored (in a Windows 10 system). The LoTW data will be incorporated into your grid highlights, statistics and awards displays.
That LoTW.adif file will be deleted:
If you click the “Clear Log” button, or
When you close the GridTracker program
But that’s not a problem because it’s only a temporary file which is being deleted. Your files at the LoTW website remain untouched.
Download QRZ Log

This button has to be turned on before it will show up in your Control Panel. See the Sections>Logging menu. Using this button to load a log works just the same way as the process described above for LoTW.
Download ClubLog

This button has to be turned on before it will show up in your Control Panel. See the Sections>Logging menu. Using this button to load a log works just the same way as the process described above for LoTW.
Time Zones Hotkey 9

Add an overlay to your GT map to show global time zone lines. But more than that: if you let your mouse hover in any zone you’ll get a popup window that gives you the local offset to GMT and the local date and time of day.
US Nexrad On/Off Hotkey Ø (the number zero)

This overlay shows weather radar feeds over the United States (only). NEXRAD (Next Generation Weather Radar) is a network of 160 high-resolution S-band Doppler weather radars operated by the National Weather Service (NWS), and other U.S. Government Agencies.
Maidenhead Grid Overlay On/Off Hotkey B

This overlay will show the actual grid lines for Maidenhead grid code for MH4, (e.g. DM78). The grids will be labeled with the two initial alphabet locators, (”DM”) or the first four characters (”DM78”) depending on the map resolution you’re using. If you want to drop down to a higher resolution click on the MH6/MH4 button to switch to MH6 grids and increase the GridTracker map resolution to make them visible. Note: these much smaller grids are not labeled, (e.g., DM78pf).
View GridTracker Users Hotkey G


This button cycles through three options that will show an overlay with flags in the locations of GridTracker users.
Don’t add an overlay
Show an overlay with flags for all the GT Users who are (1) currently online and (2) have connected to the OAMS network [elected to share their on-air status] are added to the GT Map
Show an overlay with flags for that subset of GT users who (1) are on online and using the same band/mode that you are, and (2) have chosen to share their on-air status are added to the GT map
If you allow your mouse to hover over a GT flag you’ll get a pop-up window with callsign, grid, and other location info for the user.
➤ Practice Tip: This function isn’t available unless you have turned on the Share On Air Status function.
Messaging Window

Clicking on this button opens a chat window. You’ll see a long list of callsigns in arranged in alphanumeric order in a column on the right side of the page. These are GridTracker users who have elected to share their on-air status.
Note: you must enable your “Share On Air Status” button in order to use the chat window.
If you want to see if your buddy is on line you can search the list, or, type all or part of their callsign in the open, green box at the top right corner of the window.
Note: your own call will not show up in the list unless you have multiple instances of GridTracker running and online.
History
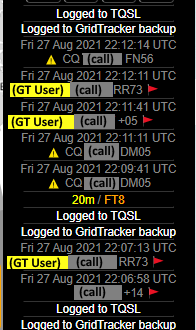

The bottom section of the Control Panel shows different information depending on whether you’re actively using WSJT-X or not.
It can show a scrolling list of the stations being decoded. It will also show stations that are calling you or stations that meet your alert criteria with alert and flag symbols as well as information about a QSO being logged.
It can also list frequencies and modes you’ve used with the most recent on top. It also shows the backup status of your GridTracker logging data, lighting strikes … . .
[^2] MH4 grid is a Maidenhead Grid: one grid = 1° in latitude by 2° in longitude. A MH4 grid is defined by two letters and two numbers - for example: EM76. The difference between MH4 and MH6 is that a MH6 grid is a “sub-grid” of the MH4 square. A MH6 grid code uses two capital letters, two numbers and two lower case letters - for example: EM76ko. Since there are 576 MH6 sub-grids within a MH4 grid they are “tiny” in size in comparison. A MH6 grid will look like a dot on the GridTracker Map until you enlarge the map quite a bit. Selecting MH6 will cause QSO/QSL stations that only provided a 4 digit Grid to disappear from the map. This is a common question from users wondering why many of their QSOs were “deleted”. Pressing Selecting MH4 will “fix” the display issue.
